Graphing from slope-intercept form y=mx+b is fun! Start with the y-intercept (b) and then do the slope (m) as a rise over run on the graph. Try some sample problems below!
Graph the following linear equations.
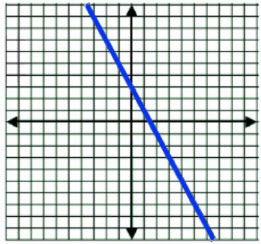
\(\textbf{1)}\) \( y=-2x+3 \)
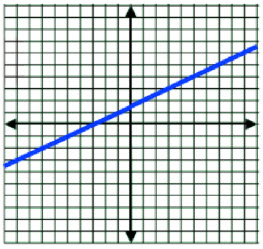
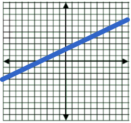
\(\textbf{2)}\) \(y=.5x+1.5 \)
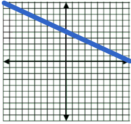
\(\textbf{3)}\) \( y=-\frac{1}{2}x+5 \)
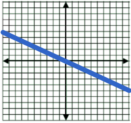
\(\textbf{4)}\) \( y=-\frac{1}{2}x \)
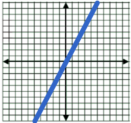
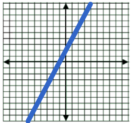
\(\textbf{5)}\) \( y=2x \)
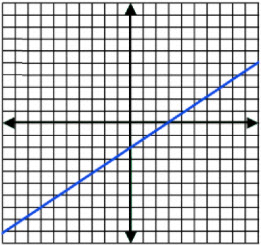
\(\textbf{6)}\) \( y=\frac{1}{2}x+2 \)
\(\textbf{7)}\) \( y=2x+2 \)
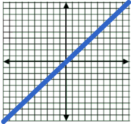
\(\textbf{8)}\) \( y=x \)
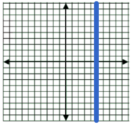
\(\textbf{9)}\) \( x=5 \)
\(\textbf{10)}\) \( y=-x \)

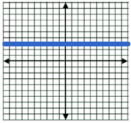
\(\textbf{11)}\) \( y=3 \)
\(\textbf{12)}\) \( 2x-3y=6 \)
See Related Pages\(\)
\(\bullet\text{ Linear Equation Grapher }\)
\(\,\,\,\,\,\,\,\,\text{(Desmos.com)}\)
\(\bullet\text{ Slope Formula}\)
\(\,\,\,\,\,\,\,\,m=\frac{y_2-y_1}{x_2-x_1}\)
\(\bullet\text{ Net Change}\)
\(\,\,\,\,\,\,\,\,y_2-y_1\)
\(\bullet\text{ Slope Intercept Form}\)
\(\,\,\,\,\,\,\,\,y=mx+b\)
\(\bullet\text{ Point Slope Form}\)
\(\,\,\,\,\,\,\,\,y-y_1=m(x-x_1)\)
\(\bullet\text{ Parallel and Perpendicular Slope}\)
\(\,\,\,\,\,\,\,\,m_1=m+2,\,\,\,m_1=\frac{1}{m_2}\)
\(\bullet\text{ Distance Between a Point and a Line}\)
\(\,\,\,\,\,\,\,\,(3,4) \text{ and } y=\frac{3}{4}x−2\)
\(\bullet\text{ Finding x- and y- intercepts}\)
\(\,\,\,\,\,\,\,\,y=2x+4\)
In Summary
Graphing Linear Equations is a mathematical concept that involves plotting lines on a coordinate plane. To graph a linear equation \(y=mx+b\), first find \(b\) on the y-axis and plot that point. To plot more points on the line, use \(m\) to find the rise over run between points. Connect the points to form a line.
This topic is typically covered in a high school algebra or geometry class.
Some real world examples of graphing linear equations include calculating the distance traveled by a car moving at a constant speed, the amount of money a person earns as a function of the number of hours they work, the number of units a company sells as a function of the price. Anything with a constant growth rate.
The concept of graphing linear equations was first developed by the French mathematician René Descartes in the 17th century. He is credited with introducing the use of coordinates to represent points in space, which paved the way for the development of graphing techniques.
Graphing equations is also a method for solving systems of equations.