Practice Problems
18 people were asked how much money they had in their wallet. The histogram shows the results.
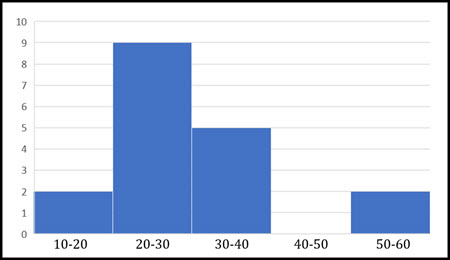
\(\textbf{1)}\) Do we know how many people had between \( $20 \) and \( $30 \) in their wallet?
\(\textbf{2)}\) Do we know how many people had between \( $10 \) and \( $40 \) in their wallet?
\(\textbf{3)}\) Do we know how many people had exactly \( $45 \) in their wallet?
\(\textbf{4)}\) Do we know how many people had exactly \( $34 \) in their wallet?
\(\textbf{5)}\) Do we know how many people had more than \( $47 \) in their wallet?
\(\textbf{6)}\) Do we know how many people had more than \( $37 \) in their wallet?
18 towns measured how many days they had heavy rain in a year. The histogram shows the result.
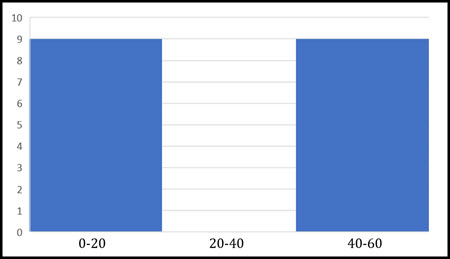
\(\textbf{7)}\) Do we know how many towns had between \( 21 \) and \( 30 \) days with heavy rain?
\(\textbf{8)}\) Do we know how many towns had between \( 10 \) and \( 39 \) days with heavy rain?
\(\textbf{9)}\) Do we know how many towns had exactly \( 45 \) days with heavy rain?
\(\textbf{10)}\) Do we know how many towns had exactly \( 34 \) days with heavy rain?
\(\textbf{11)}\) Do we know how many towns had more than \( 47 \) days with heavy rain?
\(\textbf{12)}\) Do we know how many towns had more than \( 37 \) days of heavy rain?
See Related Pages\(\)
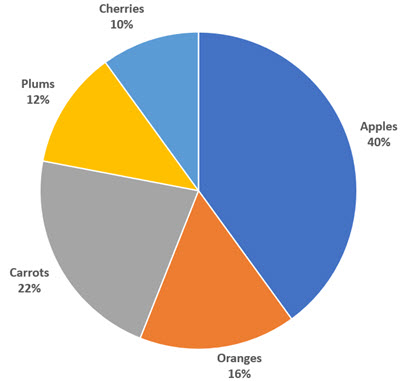
\(\bullet\text{ Circle Graphs (Pie Charts)}\)
\(\,\,\,\,\,\,\,\,\)
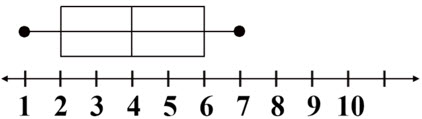
\(\bullet\text{ Box and Whisker Plot}\)
\(\,\,\,\,\,\,\,\,\,\,\,\,\,\,\,\,\)
\(\bullet\text{ Stem and Leaf Plot}\)
\(\,\,\,\,\,\,\,\,\,\,\,\,\,\,\,\,\)
In Summary
A histogram is a type of graph that displays the frequency or frequency distribution of a set of continuous or discrete data.. It is a graphical representation of data that is organized into bins and plotted on a horizontal axis. The bins represent the range of values that fall within a particular range, and the height of each bar on the graph indicates the number of values that fall within that range. It is often used in statistics and data visualization to understand and summarize the characteristics of a data set.
Histograms are covered in severals different math classes, such as statistics or data analysis, but also shows up in some middle school math classes.
To interpret a histogram, you should look at the shape of the graph, the location of the peak(s), and the overall spread of the data. The shape of the histogram can give you an idea of the distribution of the data. For example, a skewed histogram with a long tail on one side indicates that the data is not normally distributed. The location of the peak(s) on the horizontal axis can give you an idea of the central tendency of the data, and the overall spread of the data can give you an idea of the variability of the data.
It is important to keep in mind that the interpretation of a histogram can depend on the context in which the data was collected and the question you are trying to answer with the histogram. Therefore, it is always a good idea to carefully consider the context and the question before interpreting the histogram.