Questions
Use the following stem and leaf plot
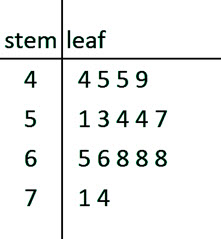
\(\textbf{1)}\) What is the Median?
The median is \(55.5\)

\(\textbf{2)}\) What is the Mode?
The mode is \(68\)
\(\textbf{3)}\) What is the Mean?
The mean is \(58.25\)
\(\textbf{4)}\) How many data points had a value of 54?
\(2\) data points were \(54\)

\(\textbf{5)}\) How many data points had a value greater than 60?
\(7\) data points were greater than \(60\)
See Related Pages\(\)
In Summary…
A stem and leaf plot is a type of graph that is used to represent the distribution of numerical data. It is similar to a histogram, but it shows the individual data points rather than grouping the data into intervals. To create a stem and leaf plot, the data is first sorted and then split into two parts: the stem, which represents the tens digit of each number, and the leaf, which represents the ones digit. The stems are listed down the left side of the graph, and the leaves are listed to the right of each stem. The leaves are typically shown as individual digits, but they can also be grouped into intervals to show the frequency of the data within each interval. Stem and leaf plots are a useful tool for visualizing the distribution of numerical data and for identifying patterns and trends in the data.