Practice Problems
Make Box and whisker plots for the following data sets.
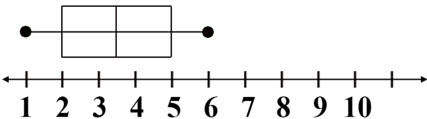
\(\textbf{1)}\) \({1,2,3,4,5,6,7}\)
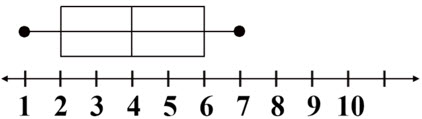
\(\textbf{2)}\) \({1,2,3,4,5,6}\)
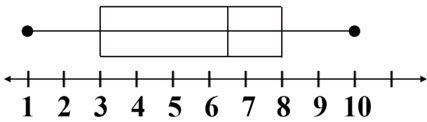
\(\textbf{3)}\) \({4,2,6,7,1,10,8,8}\)
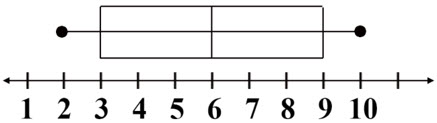
\(\textbf{4)}\) \({7,3,9,10,4,6,2}\)
See Related Pages\(\)
\(\bullet\text{ Box Plot Calculator}\)
\(\,\,\,\,\,\,\,\,\text{(Alcula.com)}\)
\(\bullet\text{ Mean, Median and Mode}\)
\(\,\,\,\,\,\,\,\,\,\,\,\,\,\,\,\,4,2,6,7,1,10,8,8…\)
\(\bullet\text{ Quartiles and IQR}\)
\(\,\,\,\,\,\,\,\,\,\,\,\,\,\,\,\,IQR=Q3-Q1…\)
\(\bullet\text{ Box and Whisker Plot}\)
\(\,\,\,\,\,\,\,\,\,\,\,\,\,\,\,\,\)
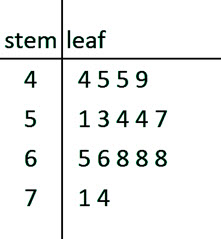
\(\bullet\text{ Stem and Leaf Plot}\)
\(\,\,\,\,\,\,\,\,\,\,\,\,\,\,\,\,\)
In Summary
A box and whisker plot, also known as a box plot, is a graphical representation of a the 5 number summary of a dataset. It summarizes the distribution of the data. It is typically used to visualize and compare the distribution of multiple datasets.
To create a box and whisker plot, the minimum and maximum values of the dataset are used to draw the ends of the horizontal axis. A box is then drawn between the first and third quartiles of the data, with a line drawn at the median. The “whiskers” of the plot are lines that extend from the box to the minimum and maximum values, indicating the range of the data. Outliers (if any) are plotted individually as points outside the range of the whiskers.
The box and whisker plot allows you to quickly see the shape and spread of the data, as well as any potential outliers. It is often used in statistics and data analysis to help visualize and compare datasets.