Lesson
Problems & Videos
Jon is playing 2 basketball games in a tournament today. The probability his team wins the first game is 65%. If they win the first game, the probability of winning the second is 80%. If the lose the first game the probability of winning the second is 45%.
\(\textbf{1)}\) Sketch out a tree diagram showing this scenario.
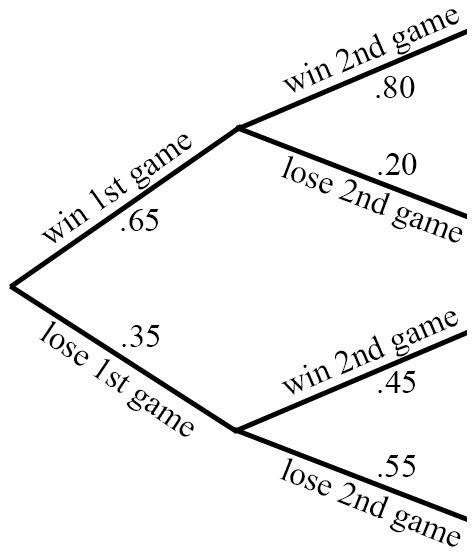
\(\textbf{2)}\) What is the probability they win both games?
\(\textbf{3)}\) What is the probability they lose both games?
\(\textbf{4)}\) What is the probability they win exactly 1 game?
\(\textbf{5)}\) What is the probability they win at least 1 game?
Below is a tree diagram showing the probability of customers of a restaurant ordering salad, and the effect that has on the probability they order juice. Answer the following questions.

\(\textbf{6)}\) What is the probability a customer orders a salad and juice?
\(\textbf{7)}\) What is the probability a customer orders juice?
\(\textbf{8)}\) What is the probability a customer orders juice given they ordered a salad?
\(\textbf{9)}\) What is the probability a customer orders salad given they ordered juice?
\(\textbf{10)}\) What is the probability a customer did not order salad?
See Related Pages\(\)
\(\bullet\text{ Statistics Homepage}\)
\(\,\,\,\,\,\,\,\,\text{All the Best Topics…}\)
\(\bullet\text{ Conditional Probabilites}\)
\(\,\,\,\,\,\,\,\,P(A|B)=\displaystyle\frac{P(A \cap B}{P(B)}…\)
\(\bullet\text{ Independent Events}\)
\(\,\,\,\,\,\,\,\,P(A \cap B)=P(A)P(B)…\)
\(\bullet\text{ Mutually Exclusive Events}\)
\(\,\,\,\,\,\,\,\,P(A \cap B)=0…\)
\(\bullet\text{ Venn Diagrams}\)
\(\,\,\,\,\,\,\,\,\) …
…
\(\bullet\text{ Two-Way Tables}\)
\(\,\,\,\,\,\,\,\,\) …
…
In Summary
A tree diagram is a graphical representation of possible outcomes in a probability experiment. It shows all of the possible outcomes in a hierarchical structure, with the branches of the tree representing each possible outcome and its probability.
To create a tree diagram, you first need to identify the possible outcomes of the experiment and their probabilities. These probabilities should be expressed as fractions or decimals, and should sum to 1 (since there is a 100% chance that one of the outcomes will occur).
Once you have identified the possible outcomes and their probabilities, you can create the tree diagram by starting with a single root node that represents the beginning of the experiment. Then, for each possible outcome, you would add a branch to the tree diagram that represents that outcome and its probability. This process is repeated for each subsequent possible outcome, until the tree is complete.
Tree diagrams can be used for many different types of problems, including decision making, statistical analysis, and game theory. They are a useful tool for visualizing complex processes and can help you better understand the relationships between different events.