Notes

Questions
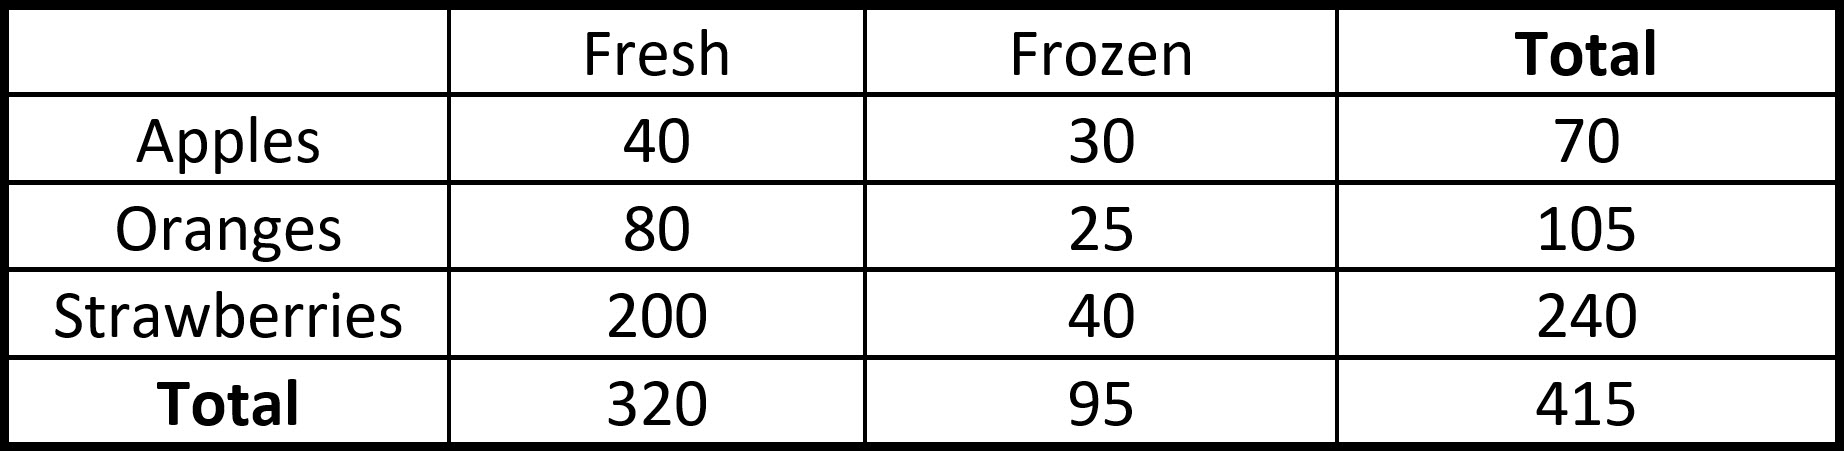
\(\textbf{1)}\) P (apples)
\(\textbf{2)}\) P (apples and frozen)
\(\textbf{3)}\) P (apples or frozen)
\(\textbf{4)}\) P (apples or strawberries)
\(\textbf{5)}\) P (apples and strawberries)
\(\textbf{6)}\) P (apples | frozen)
\(\textbf{7)}\) P (frozen given apples)
\(\textbf{8)}\) Are apples and frozen independent?
See Related Pages\(\)
\(\bullet\text{ Statistics Homepage}\)
\(\,\,\,\,\,\,\,\,\text{All the Best Topics…}\)
\(\bullet\text{ Conditional Probabilites}\)
\(\,\,\,\,\,\,\,\,P(A|B)=\displaystyle\frac{P(A \cap B}{P(B)}…\)
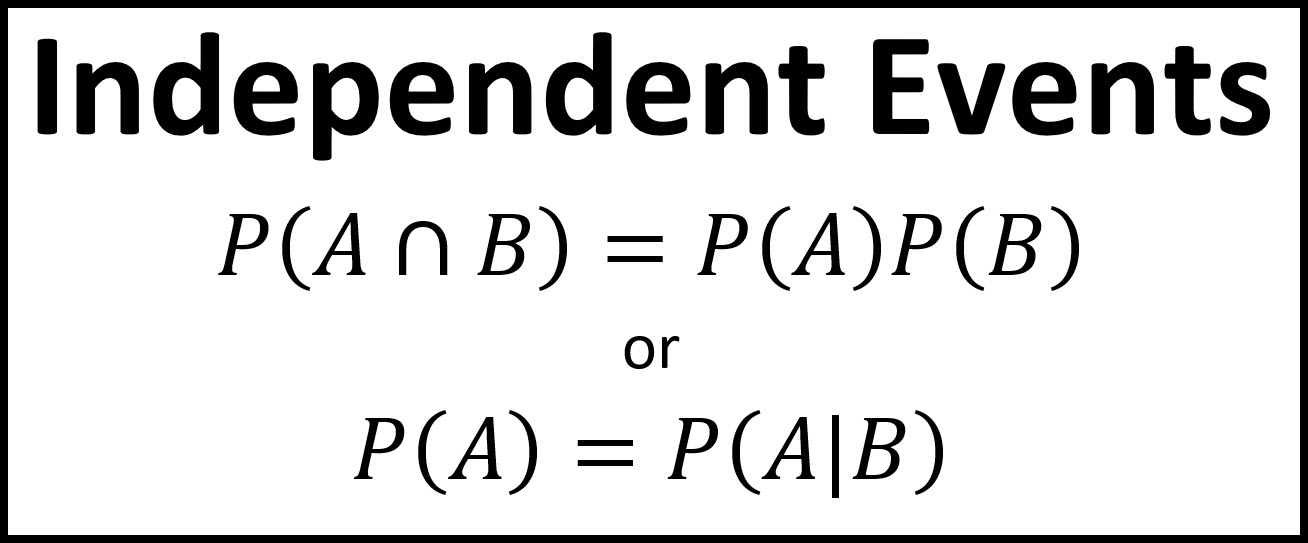
\(\bullet\text{ Independent Events}\)
\(\,\,\,\,\,\,\,\,P(A \cap B)=P(A)P(B)…\)
\(\bullet\text{ Mutually Exclusive Events}\)
\(\,\,\,\,\,\,\,\,P(A \cap B)=0…\)
\(\bullet\text{ Venn Diagrams}\)
\(\,\,\,\,\,\,\,\,\) \(…\)
\(…\)
\(\bullet\text{ Tree Diagrams}\)
\(\,\,\,\,\,\,\,\,\) \(…\)
\(…\)
In Summary
A two-way table is a type of table that displays the relationship between two different variables. It can be used to organize and summarize data, and to calculate probabilities.
“Two-way tables” are also known as “contingency tables”, “cross tabulations”, “crosstabs” and on spreadsheets, “pivot tables”.
To calculate probabilities from a two-way table, you need to first determine the total number of outcomes in the sample space. This is the total number of items in the table. Then, for a given event, you can count the number of outcomes that fall within that event and divide by the total number of outcomes to find the probability of that event occurring. There are many ways you can use these tables to analyze data and draw conclusions.