Notes
Problems
Find the mean absolute deviation of the following data sets.
\(\textbf{1)}\) \( \{2,2,8,5,10,15\} \)
\(\textbf{2)}\) \( \{7,3,5,9,1\} \)
\(\textbf{3)}\) \( \{1,5,8,8\} \)
\(\textbf{4)}\) \( \{0,0,4,3,8\} \)
\(\textbf{5)}\) \( \{7,3,5,6,4\} \)
\(\textbf{6)}\) \( \{10,1,3,2\} \)
See Related Pages\(\)
\(\bullet\text{ Mean, Median and Mode}\)
\(\,\,\,\,\,\,\,\,\,\,\,\,\,\,\,\,4,2,6,7,1,10,8,8…\)
\(\bullet\text{ Quartiles and IQR}\)
\(\,\,\,\,\,\,\,\,\,\,\,\,\,\,\,\,IQR=Q3-Q1…\)
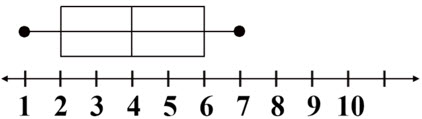
\(\bullet\text{ Box and Whisker Plot}\)
\(\,\,\,\,\,\,\,\,\,\,\,\,\,\,\,\,\)
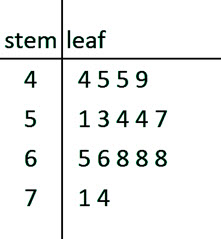
\(\bullet\text{ Stem and Leaf Plot}\)
\(\,\,\,\,\,\,\,\,\,\,\,\,\,\,\,\,\)
In Summary
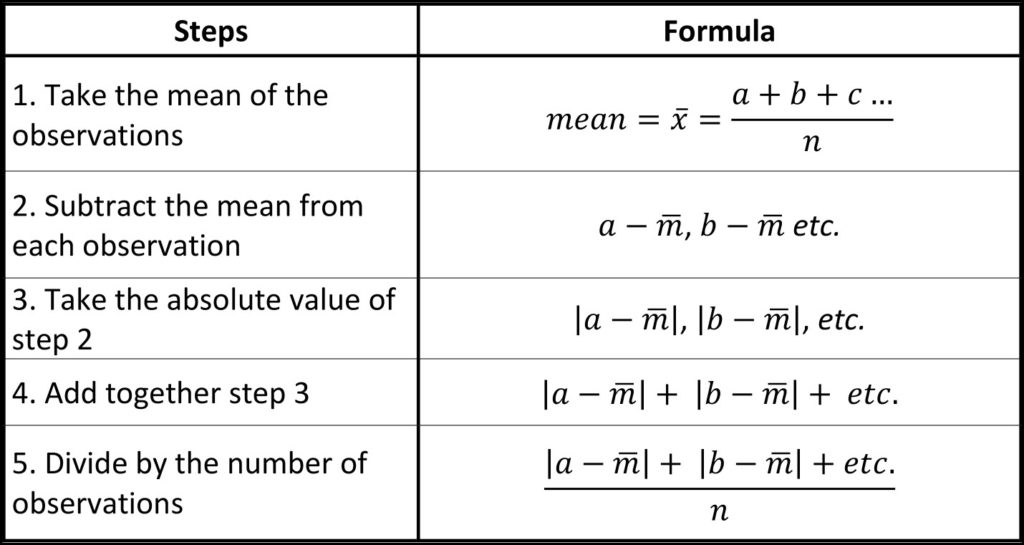
Mean absolute deviation (MAD) is a statistical measure that helps to quantify the dispersion of a dataset around the mean. Or in other words, how much a set of numbers is spread out. It is calculated by taking the average of the absolute differences between each data point and the mean. MAD is often used in conjunction with the mean to describe the central tendency and spread of a dataset.
The MAD is a useful measure of variability because it is relatively easy to understand and interpret. It is sometimes used in statistics as an alternative to the standard deviation.
Mean absolute deviation (MAD) is typically taught in statistics classes, but may be part of a middle school math class due to its ease of calculation.