Skip to content
Graph the following quadratic functions.
Give the domain and range.
\(\textbf{1)}\) \( f(x)=(x+3)^2-2 \)
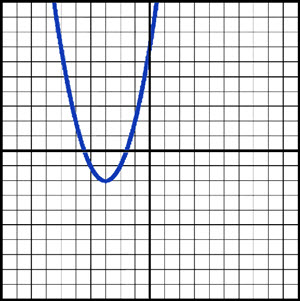
Domain: All Real Numbers
Range: \(y\ge-2\)
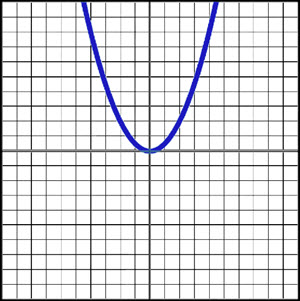
\(\textbf{2)}\) \( f(x)=x^2 \)
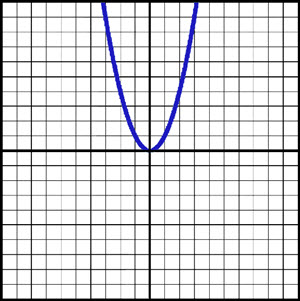
Domain: All Real Numbers
Range: \( y\ge0\)
\(\textbf{3)}\) \( f(x)=2x^2 \)
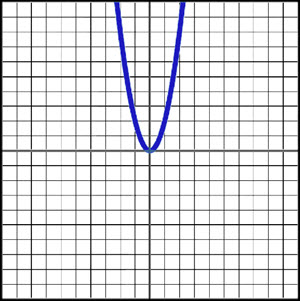
Domain: All Real Numbers
Range: \( y\ge0\)
\(\textbf{4)}\) \( f(x)=-2(x+2)^2+4 \)
Domain: All Real Numbers
Range: \( y\le4\)
\(\textbf{5)}\) \( f(x)=3(\frac{-x}{2})^2 \)
Domain: All Real Numbers
Range: \( y\ge0\)
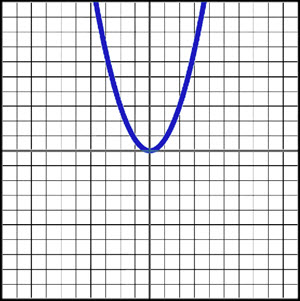
\(\textbf{6)}\) \( f(x)=\frac{1}{2}(-x)^2 \)
Domain: All Real Numbers
Range: \( y\ge0\)
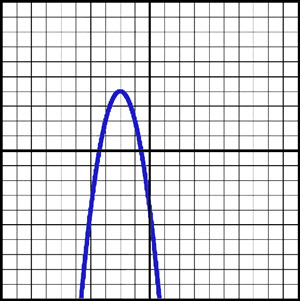
\(\textbf{7)}\) \( f(x)=-2(x+1)^2 \)
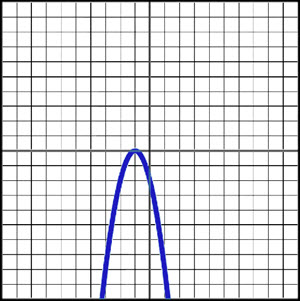
Domain: All Real Numbers
Range: \( y\le0\)
\(\textbf{8)}\) \( f(x)=-(2-x)^2 \)
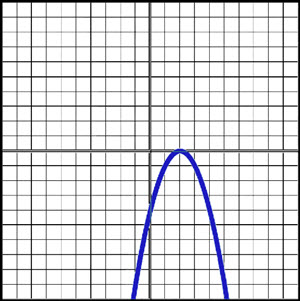
Domain: All Real Numbers
Range: \( y\le0\)
See Related Pages\(\)