Graph each system of inequalities.
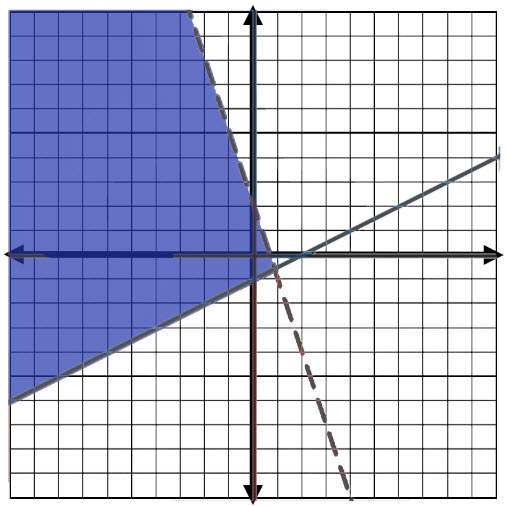
\(\textbf{1)}\) \( y\lt-3x+2 \)
\(\) \( y\ge\frac{1}{2}x-1 \)
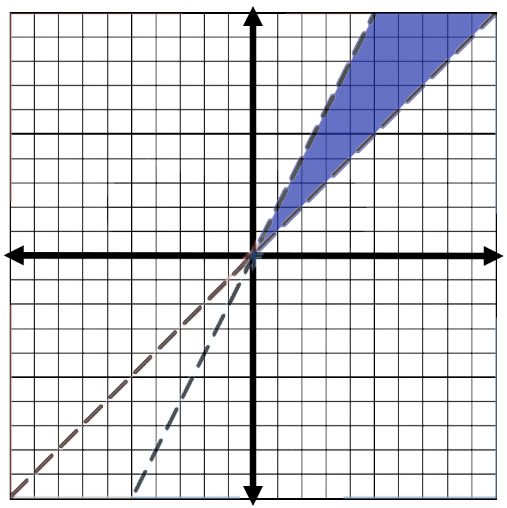
\(\textbf{2)}\) \( y\gt x \)
\(\) \( y\lt2x \)
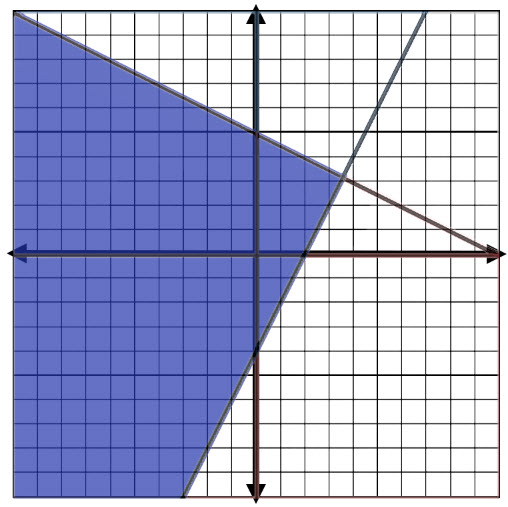
\(\textbf{3)}\) \( x+2y\le10 \)
\(\) \( 2x-y\le4 \)
\(\textbf{4)}\) \( x\le4 \)
\(\) \( x\ge-2 \)
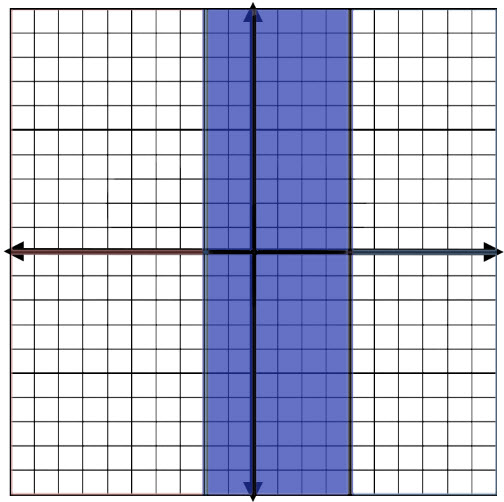
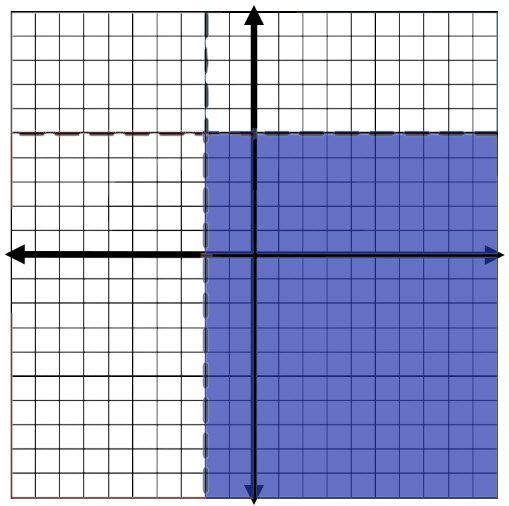
\(\textbf{5)}\) \( y\lt5 \)
\(\) \( x\gt-2 \)
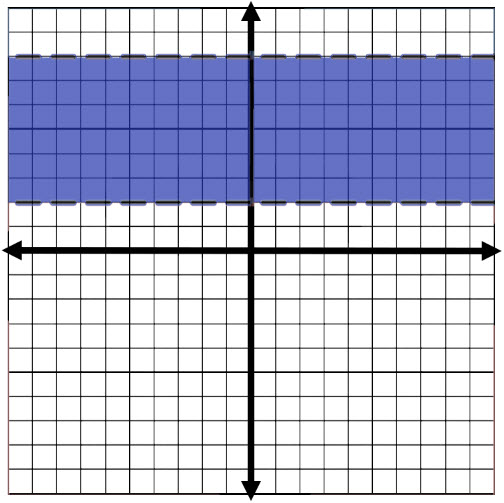
\(\textbf{6)}\) \( y\lt8 \)
\(\) \( y\gt2 \)
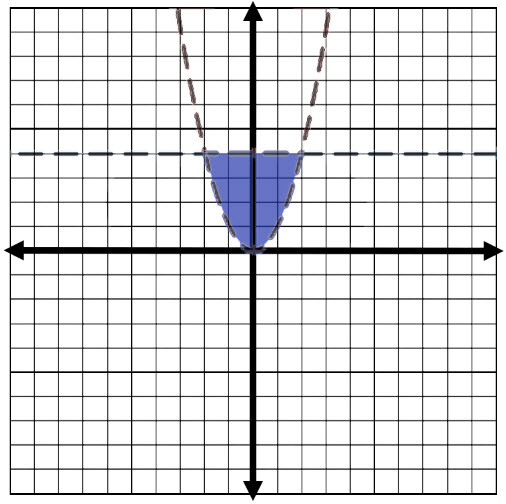
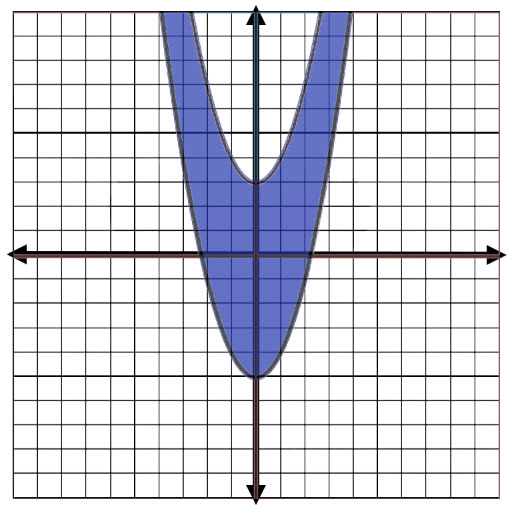
\(\textbf{7)}\) \( y\gt x^2 \)
\(\) \( y\lt4 \)
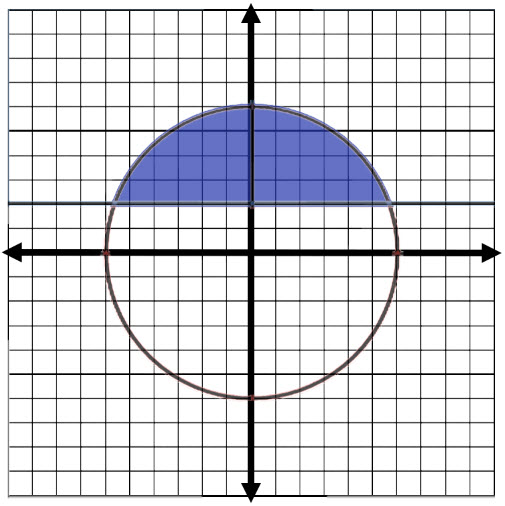
\(\textbf{8)}\) \( x^2+y^2\le36 \)
\(\) \( y\ge3 \)
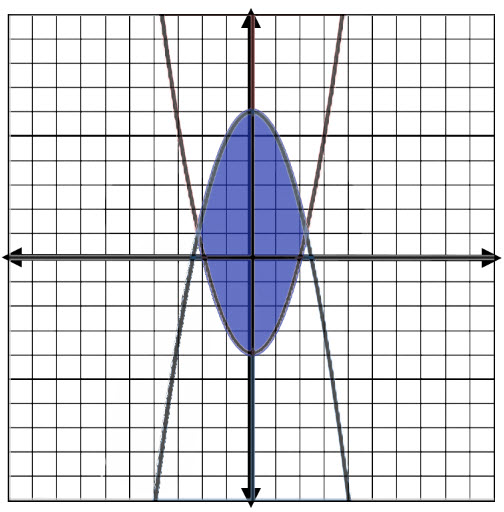
\(\textbf{9)}\) \( y\ge x^2-4 \)
\(\) \( y\le -x^2+6 \)
\(\textbf{10)}\) \( y\le x^2+3 \)
\(\) \( y\ge x^2-5 \)
See Related Pages\(\)
\(\bullet\text{ Solving Systems with Substitution}\)
\(\,\,\,\,\,\,\,\,y=−2x+5\)
\(\,\,\,\,\,\,\,\,y=x-1…\)
\(\bullet\text{ Solving Systems with Elimination}\)
\(\,\,\,\,\,\,\,\,7x+4y=31 \)
\(\,\,\,\,\,\,\,\,3x+2y=15…\)
\(\bullet\text{ 3 variable systems}\)
\(\,\,\,\,\,\,\,\,2x+3y−5z=−7 \)
\(\,\,\,\,\,\,\,\,3x−6y+4z=3 \)
\(\,\,\,\,\,\,\,\,x+4y+2z=15…\)
\(\bullet\text{ Nonlinear Systems}\)
\(\,\,\,\,\,\,\,\,x^2+y^2=8 \)
\(\,\,\,\,\,\,\,\,y=x…\)
Desmos Graphing Tool
\( \text{Click Here for Helpful Desmos Graph}\)
In Summary
Graphing systems of inequalities involves plotting the solutions to multiple inequalities on the same coordinate plane. The solution region is the area where all are true.
Graphing systems of inequalities is typically covered in a high school or college algebra or pre-calculus class.
Graphing systems of inequalities is the method used to represent and solve real-world problems involving constraints or limitations, such as finding the maximum or minimum value of a quantity subject to certain conditions. A real world example example is in finding the maximum profit that can be earned subject to a given a set of production and market conditions.