Practice Problems
Make a histogram with the following data. Use groups of size 10.
\(\textbf{1)}\) \( 12, 26, 24, 16, 24, 58, 33, 34, 35, 25, 28, 29, 33, 31, 22, 21, 25, 55 \)
\(\textbf{2)}\) \( 5, 24, 33, 35, 36, 15, 12, 3, 16, 17, 4, 15, 4, 5, 17, 18, 19, 32 \)
\(\textbf{3)}\) \( 1, 5, 2, 7, 8, 4, 41, 50, 55, 42, 27, 54, 44, 44, 43, 15, 2, 3 \)
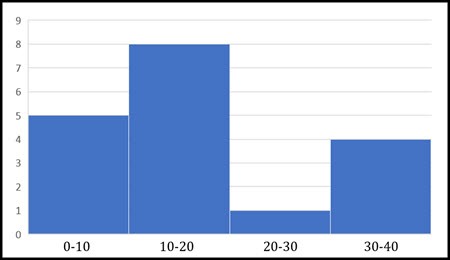
18 people were asked how much money they had in their wallet. The histogram shows the results.
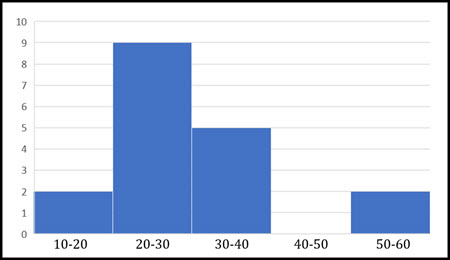
\(\textbf{4)}\) Do we know how many people had between \( $20 \) and \( $30 \) in their wallet?
The answer is \( 9 \) people.
\(\textbf{5)}\) Do we know how many people had between \( $10 \) and \( $40 \) in their wallet?
The answer is \( 16 \) people.
\(\textbf{6)}\) Do we know how many people had exactly \( $45 \) in their wallet?
The answer is \(0\) people.
\(\textbf{7)}\) Do we know how many people had exactly \( $34 \) in their wallet?
The answer is no. We know \(5\) people have between \($30\) and \($40\), but we don’t how many people had exactly \($34\). (We do know it is some number between \(0\) people and \(5\) people.)
\(\textbf{8)}\) Do we know how many people had more than \( $47 \) in their wallet?
The answer is yes. We know \(2\) people have more than \($47\) in their wallet.
\(\textbf{9)}\) Do we know how many people had more than \( $37 \) in their wallet?
The answer is no. We do not know the distribution of people in the \($30-$40\) bucket, so we can’t say exactly how many people have more than \($37\) in their wallet. (We do know it is some number between \(2\) people and \(7\) people.)
18 towns measured how many days they had heavy rain in a year. The histogram shows the result.
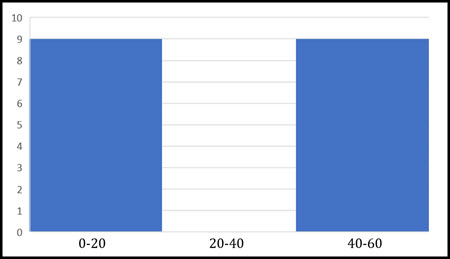
\(\textbf{10)}\) Do we know how many towns had between \( 21 \) and \( 30 \) days with heavy rain?
The answer is \( 0 \) towns.
\(\textbf{11)}\) Do we know how many towns had between \( 10 \) and \( 39 \) days with heavy rain?
No, we do not know how many towns had between \( 10 \) and \( 40 \) days of heavy rain.
\(\textbf{12)}\) Do we know how many towns had exactly \( 45 \) days with heavy rain?
The answer is no. We know \(9\) towns have between \(40\) and \(60\) days with heavy raid, but we don’t how many towns had exactly \(45\) days of heavy rain. (We do know it is some number between \(0\) towns and \(9\) towns.)
\(\textbf{13)}\) Do we know how many towns had exactly \( 34 \) days with heavy rain?
The answer is \(0\) towns.
\(\textbf{14)}\) Do we know how many towns had more than \( 47 \) days with heavy rain?
The answer is no. We do not know the distribution of towns in the \(40-60\) bucket, so we can’t say exactly how many towns have more than \(47\) days of heavy rain. (We do know it is some number between \(0\) towns and \(9\) towns.)
\(\textbf{15)}\) Do we know how many towns had more than \( 37 \) days of heavy rain?
The answer is yes. We know \(9\) towns have more than \(37\) days of heavy rain.
See Related Pages\(\)
In Summary
A histogram is a type of graph that is used to represent the distribution of numerical data. It is similar to a bar graph, but it shows the frequency of data within a set of intervals (or “bins”) instead of showing the individual data points. To create a histogram, the data is first divided into a set of intervals, and then a bar is plotted for each interval with the height of the bar representing the frequency of the data within that interval. The bars in a histogram can be either adjacent or separated, depending on the type of histogram being used. Histograms are a useful tool for visualizing the distribution of numerical data and for identifying patterns and trends in the data.